
Understanding Principal Component Analysis (PCA) Algorithm in Data Science
Introduction
In the world of data science, techniques for dimensionality reduction are crucial, especially when dealing with large datasets with many features. One of the most well-known methods for achieving this is Principal Component Analysis, or PCA. PCA is a technique used to transform data with many dimensions into data with fewer dimensions, while still retaining important information from the original data. This article will discuss the basic concept of PCA, how it works, and its applications in data analysis.
What is Principal Component Analysis (PCA)?
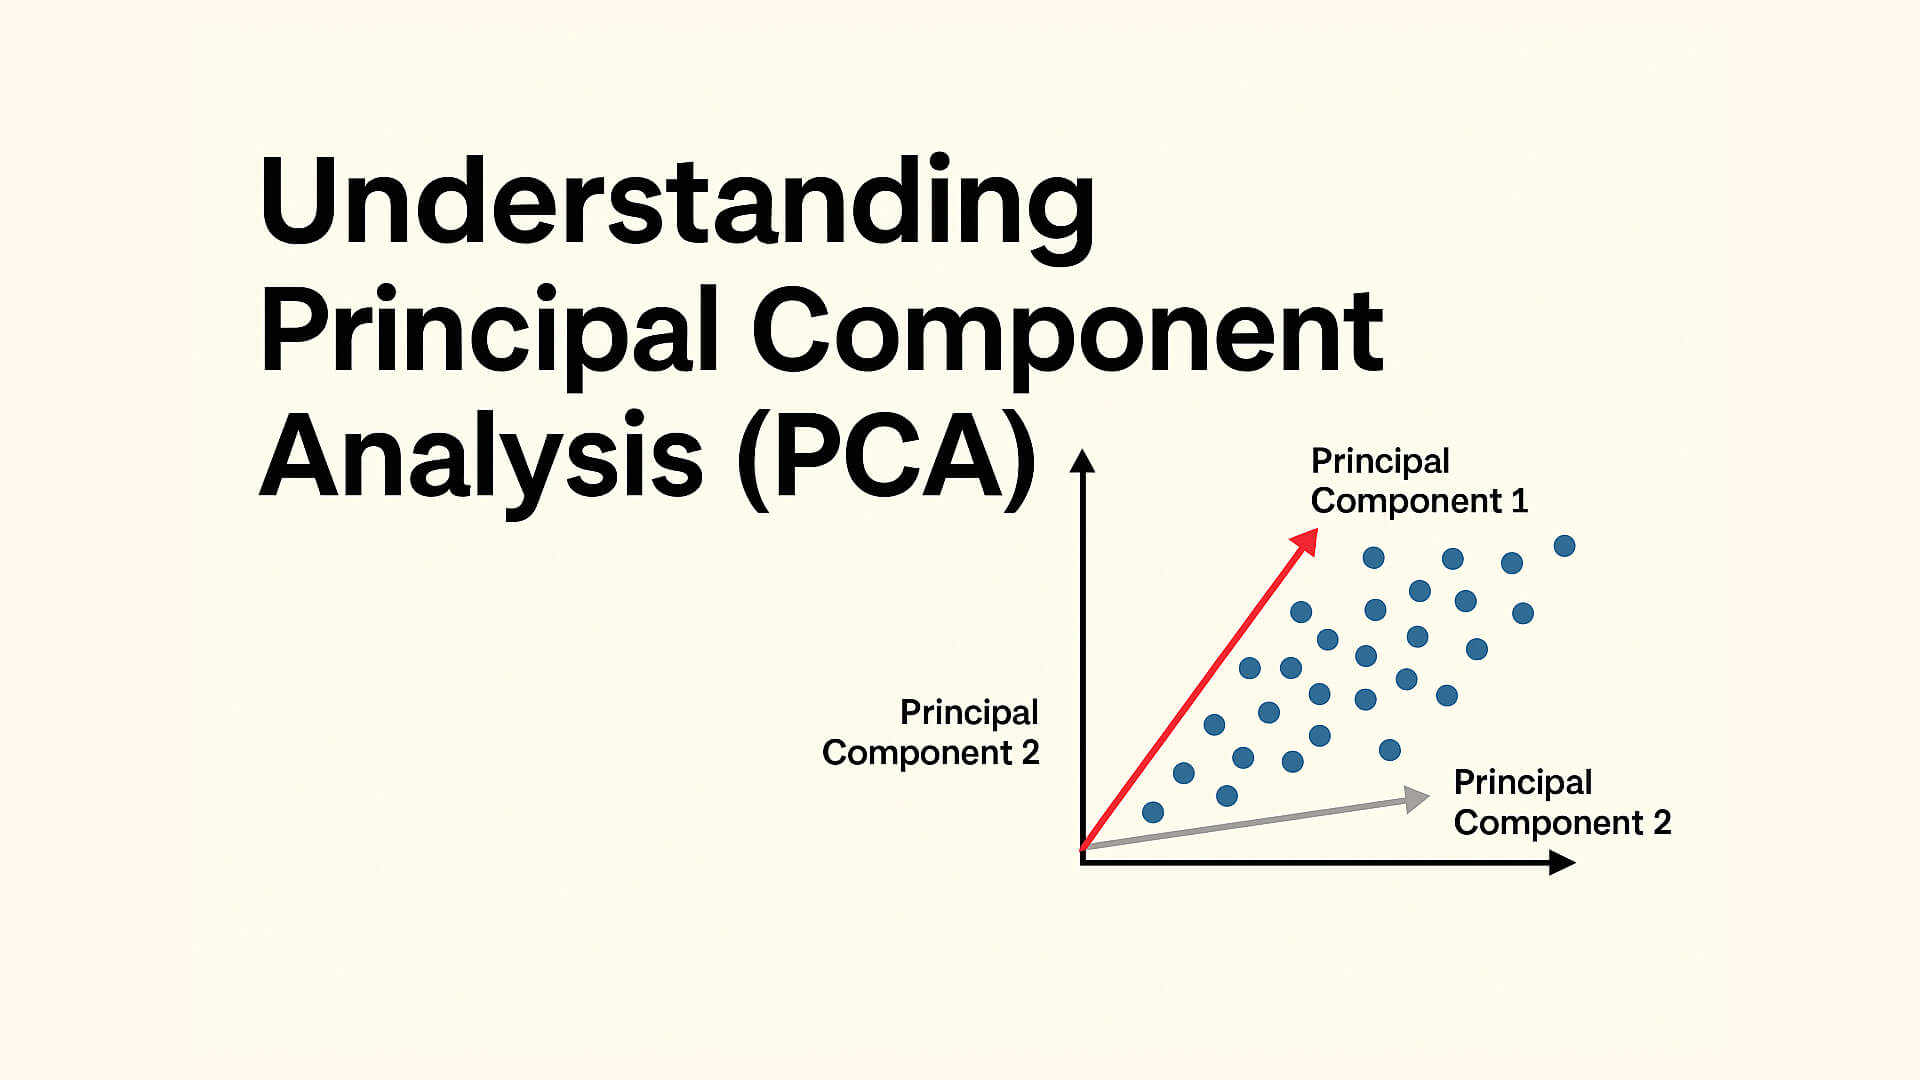
Principal Component Analysis (PCA) is a statistical technique used to reduce the dimensionality of data by identifying the directions of maximum variance in the data. In other words, PCA finds linear combinations of the original variables that most effectively represent the data. Each of these linear combinations is referred to as a principal component.
In general, PCA is used when we have data with many features, but not all of those features are necessary for further analysis. PCA helps us find the key features that can represent the data in lower dimensions, making it easier to analyze and process.
How PCA Works
-
Standardizing the Data
The first step in PCA is to standardize the data. This is important because PCA is very sensitive to the scale of variables. For example, if one feature has a much larger range of values than another, the larger feature will dominate the results of PCA. To avoid this, we standardize each feature of the data to have a mean of 0 and a standard deviation of 1. -
Calculating the Covariance Matrix
After standardizing the data, the next step is to compute the covariance matrix. This matrix describes the relationships between the features in the data. If two features have a high covariance, it means they are strongly related to each other. -
Calculating Eigenvalues and Eigenvectors
The next step is to compute the eigenvalues and eigenvectors of the covariance matrix. Eigenvectors represent the principal directions of the data, while eigenvalues describe how much variance is explained by each eigenvector. -
Selecting Principal Components
After obtaining the eigenvectors and eigenvalues, we select the principal components based on the largest eigenvalues. These principal components represent the directions of greatest variance in the data. The larger the eigenvalue, the more important that principal component is in explaining the data's variance. -
Transforming the Data
The final step is to project the data into a new space based on the selected principal components. This allows the data, which initially had many dimensions, to be reduced to fewer dimensions while retaining important information.
Applications of PCA in Data Science
PCA has various applications in data science and machine learning, including:
-
Dimensionality Reduction
PCA is often used to reduce the dimensionality of data before applying machine learning models. Reducing dimensions can help improve model performance and reduce the risk of overfitting. -
Data Visualization
When working with data that has many features, visualization becomes very difficult. With PCA, we can reduce the data to 2 or 3 dimensions, making it possible to visualize the data in the form of graphs. -
Feature Selection
PCA can be used to select the most important features in a dataset, so only the relevant features are used for further analysis or prediction models. -
Noise Reduction
In some cases, data may contain noise that can affect model performance. PCA can help reduce noise by focusing on the principal components that capture the most variance in the data.
Conclusion
Principal Component Analysis (PCA) is a powerful technique in data science used to reduce the dimensionality of data by identifying the principal components that explain the most variance in the data. By understanding the basic concept and how PCA works, we can use it to improve the performance of data analysis and machine learning models. While PCA is not a one-size-fits-all solution for every type of data, having a good understanding of when and how to use it can be very helpful in simplifying complex data problems.